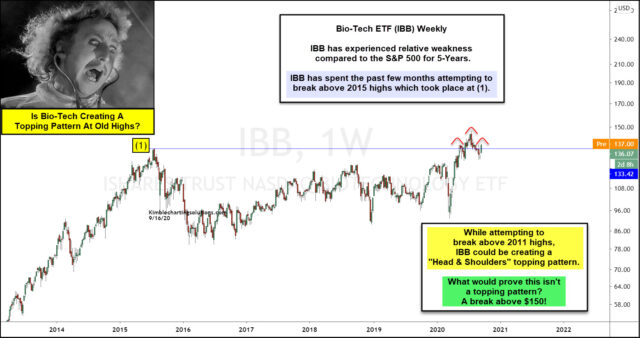
Biotech ETF Weekly Chart.
Biotech ETF (NASDAQ:IBB) has performed better than the S&P 500, by nearly 9% this year, which sends a short-term bullish message.
The same positive performance message cannot be said for IBB over the past five years, as it lags the S&P 500 by more than 50% since the 2011 highs.
Is this long-term underperformance for Biotech stocks about to come to an end? We should find out very soon.
IBB is currently testing 2011 highs over the past four months, where it is possible it is creating a short-term “head-and-shoulders” topping pattern.
What would IBB have to do to eliminate the potential topping pattern? A close above $150 would end this pattern and suggest that is 2020 relative strength will continue.
Keep a close eye on IBB over the next few weeks, as its price action should send an important short and long-term price message.
Is Bio-Tech Creating Head-And-Shoulders Topping Pattern?
Fusion Media or anyone involved with Fusion Media will not accept any liability for loss or damage as a result of reliance on the information including data, quotes, charts and buy/sell signals contained within this website. Please be fully informed regarding the risks and costs associated with trading the financial markets, it is one of the riskiest investment forms possible.


