Since the US stock market hit bottom on March 23, the subsequent rally has been swift but uneven. An elite set of sectors have outperformed the broad market, based on a set of ETFs through Tuesday’s close. The majority, however, are still playing catch-up.
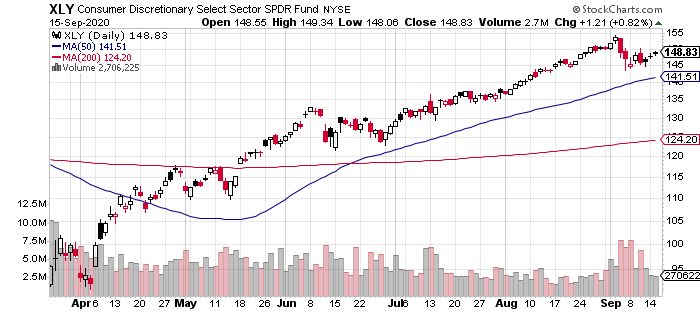
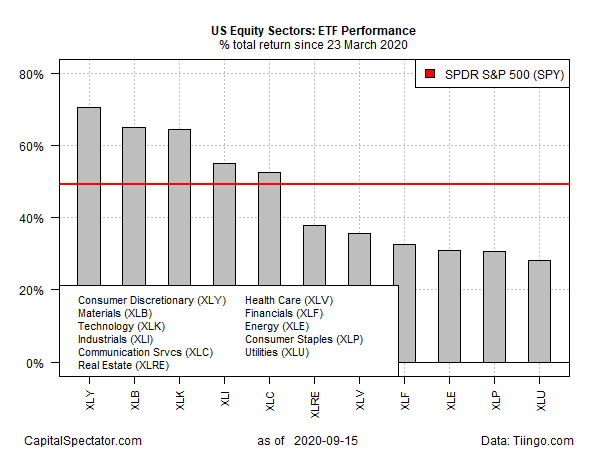
The good news from a sector perspective: everything has bounced since the darkest point for the stock market during the coronavirus crash in late-March. The leading bounce is currently held by Consumer Discretionary Select Sector (NYSE:XLY), which is up nearly 71% since Mar. 23.

XLY Daily Chart
Topped up with the likes of Amazon (NASDAQ:AMZN), Home Depot (NYSE:HD) and McDonald’s (NYSE:MCD), XLY’s portfolio of consumer discretionary shares has been red hot since the market crashed. By contrast, so-called consumer staples–often considered a relatively defensive corner of the market–has lagged its discretionary brethren.
Consumer Staples Select Sector (NYSE:XLP) is up 30.7% from the previous market bottom. That’s a respectable gain in the grand scheme of six-month results, but in relative terms for this year it’s near the bottom – only the utility sector’s 20.1% bounce (via Utilities Select Sector (NYSE:XLU)) since Mar. 23 is weaker.

US Equity Sectors Total Return Chart
The overall market, meanwhile, is ahead by more than 43% for the post-crash rally, based on SPDR S&P 500 (NYSE:SPY). Although the results vary widely by sector, SPY’s strong gain is a reminder that equity beta still has the capacity to lift all boats, albeit unevenly.
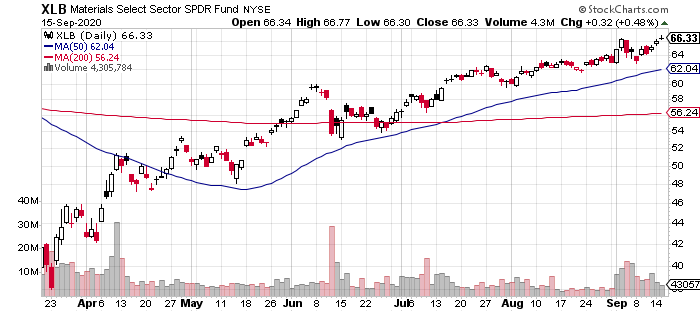
Perhaps the surprise rally of late is the strong run for materials stocks. As the second-strongest gainer since Mar. 23, Materials Select Sector (NYSE:XLB) is higher by 65.0%. But in terms of setting new highs, XLB is in a class by itself these days. Indeed, XLB ticked up yesterday, closing at a new high on Sep. 15. At the moment, this is the only sector fund on our list that’s reached previously virgin price terrain.

XLB Daily Chart
Ranking The Market’s Rebound By Equity Sectors
Fusion Media or anyone involved with Fusion Media will not accept any liability for loss or damage as a result of reliance on the information including data, quotes, charts and buy/sell signals contained within this website. Please be fully informed regarding the risks and costs associated with trading the financial markets, it is one of the riskiest investment forms possible.


