Stocks fell yesterday, reversing the early morning gains. Perhaps the market was merely waiting for a reason to drop, or maybe the Fed didn’t deliver the correct message. Either way, the S&P 500 rose to around 3,425 and then fell in a straight line by 1.25% to finish down by 46 basis points. Meanwhile, the NASDAQ 100 ETF (NASDAQ:QQQ) fell by over 1.6% on the day and dropped by 2.25% from peak to trough.
Perhaps these big intraday swings are par for the course, or maybe it was the Fed’s bleak inflation and growth outlook that weighed on stocks. Remember, gold has risen on this concept “that money printing would raise inflation rates,” clearly the Fed disagrees with that view. The Fed noted that inflation would remain below 2% through the year 2023. So if there is no inflation on the horizon, then why is gold over $2,000, and why is silver over $20.
As I have explained over, and over, and over, and over again, money printing alone does NOT spur inflation; you need money printing and output growth, AKA GDP growth, to spur inflation. The velocity of MZM tells us this. With all the MZM creation there has been, it will take years for the GDP to catch up to MZM get the ratio back to pre-COVID levels, around 1.2.
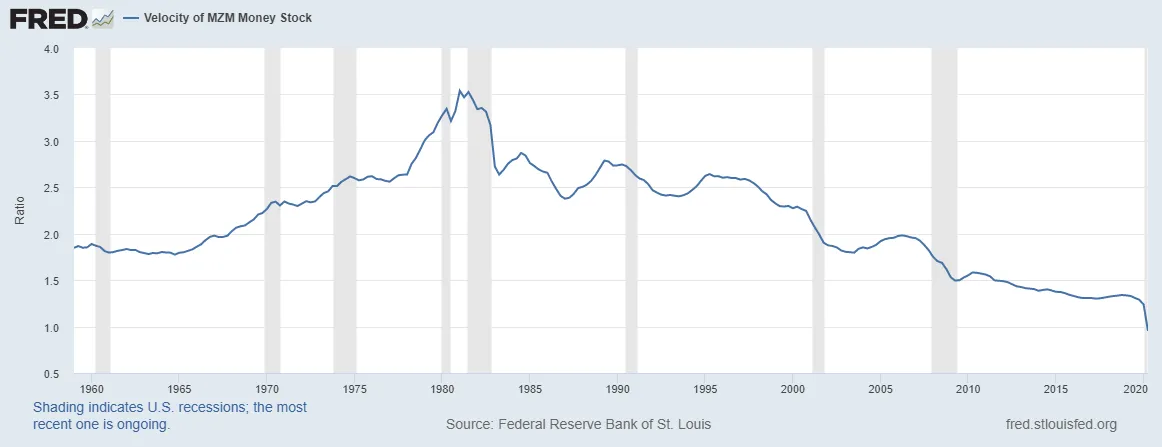
Velocity Of MZM Money Stock
The MZM money supply currently stands at $21.1 trillion, while the total nominal GDP is $19.5 billion. The GDP needs to grow over 8%, to get to MZM supply, assuming MZM doesn’t grow, which won’t happen. It means meager inflation to near no inflation environment for a very long time. The Fed knows this; that is why they are shifting to an average inflation target.
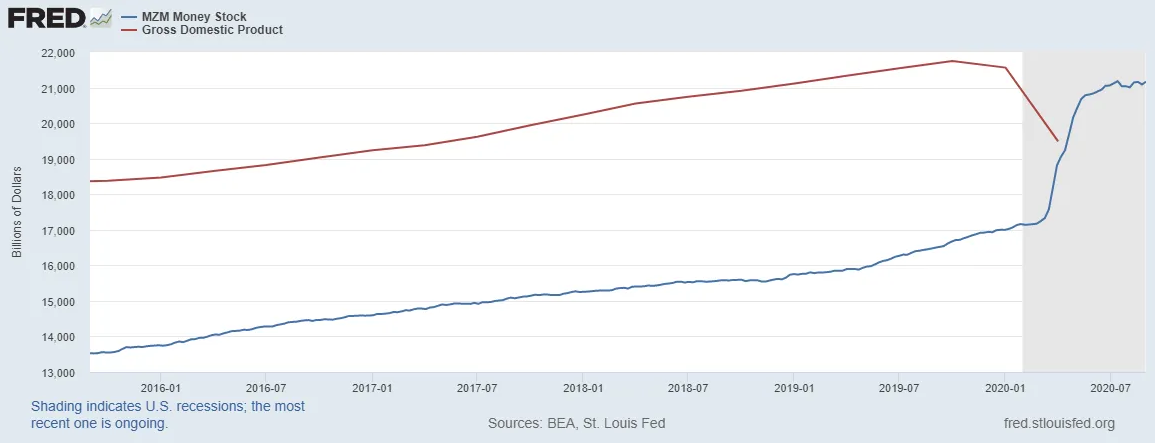
MZM Money Stock vs GDP
As I explained in today’s post-FOMC audio update, on the update board of the chatroom, this could be bad news for big-time growth stocks. The reason is that valuation on these high growth stocks has gone up tremendously, anticipating higher inflation rates. Higher inflation gives these high growth companies even more revenue and earnings growth, and in the case of high margin business margin expansion. But with lower inflation expectations, it means that there will likely need to be a reset.
S&P 500 (SPY)
Anyway, the S&P 500 (SPDR S&P 500 (NYSE:SPY)) failed to push past 3,425, and I think that sets up for that push lower to 3,340.
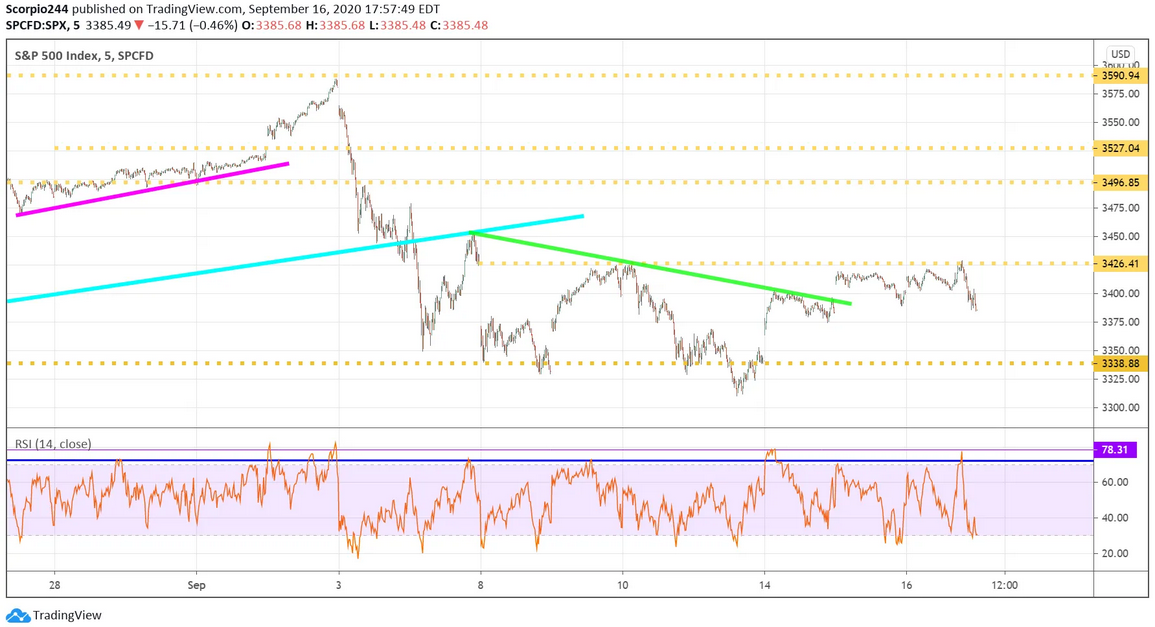
S&P 500 Index
NASDAQ 100 (QQQ)
Meanwhile, NASDAQ 100, via the Qs, tested and fell below $275 yesterday, likely setting up that drop to $270.
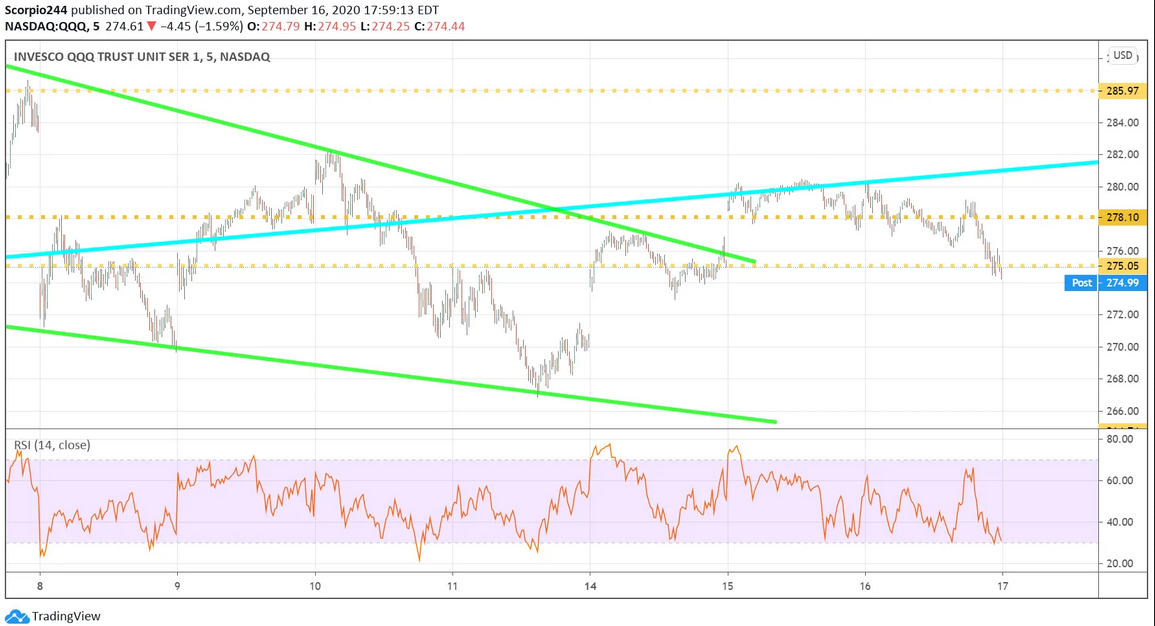
QQQ Chart
Amazon
Amazon (NASDAQ:AMZN) just fell below support around $3,100 yesterday, and that is a bad indication. It likely means this stock has further to drop. I still think $2,800 is coming.
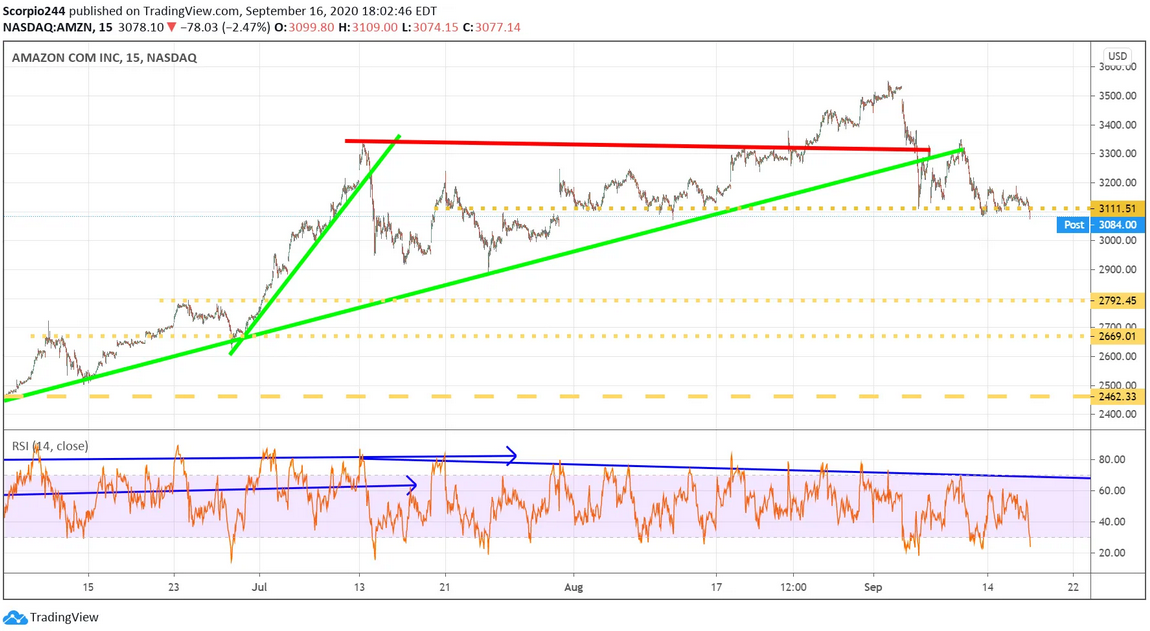
Amazon Inc Daily Chart
Apple
Apple (NASDAQ:AAPL) also struggled, and is nearing a significant breakdown; options traders are betting on it. $108 is the next level to watch for.
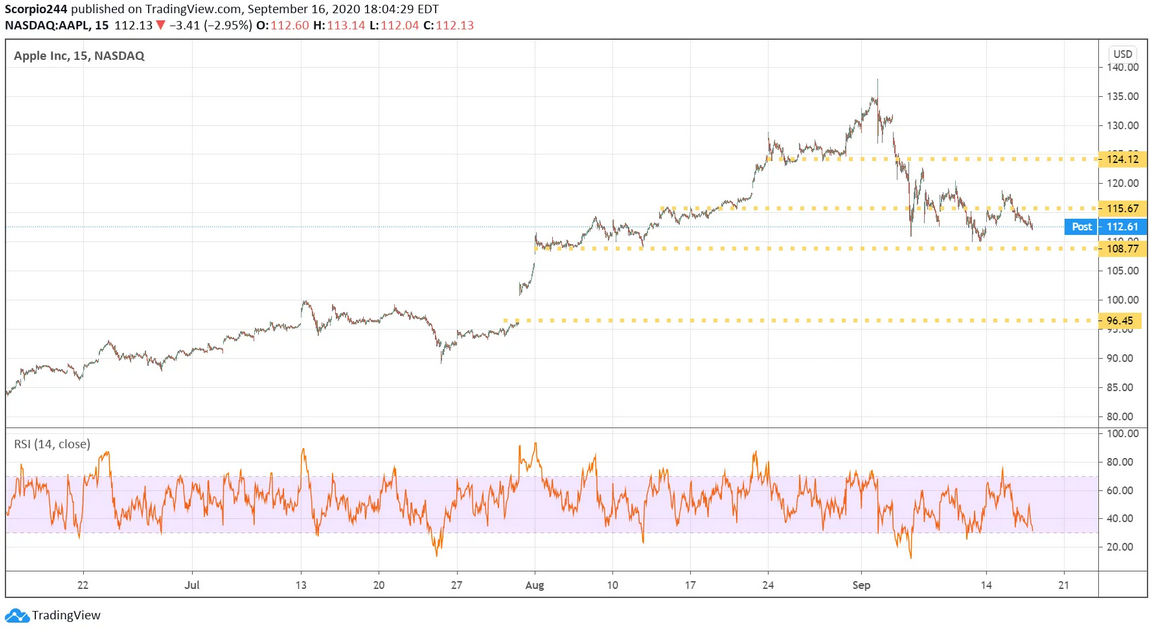
Apple Inc Chart
PayPal
Wednesday was not the greatest day for PayPal (NASDAQ:PYPL), with this stock teetering on the edge of a big breakdown of its own, and the potential to drop to around $165.
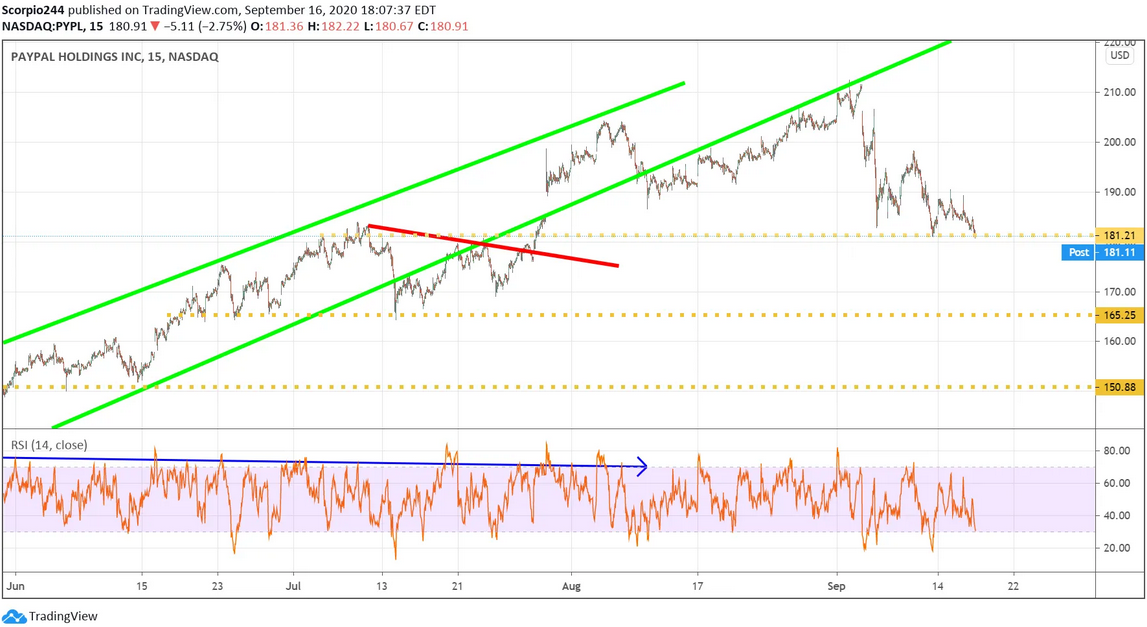
Paypal Daily Chart
Facebook (NASDAQ:FB) will need to hold $259 to avoid a drop to $235.
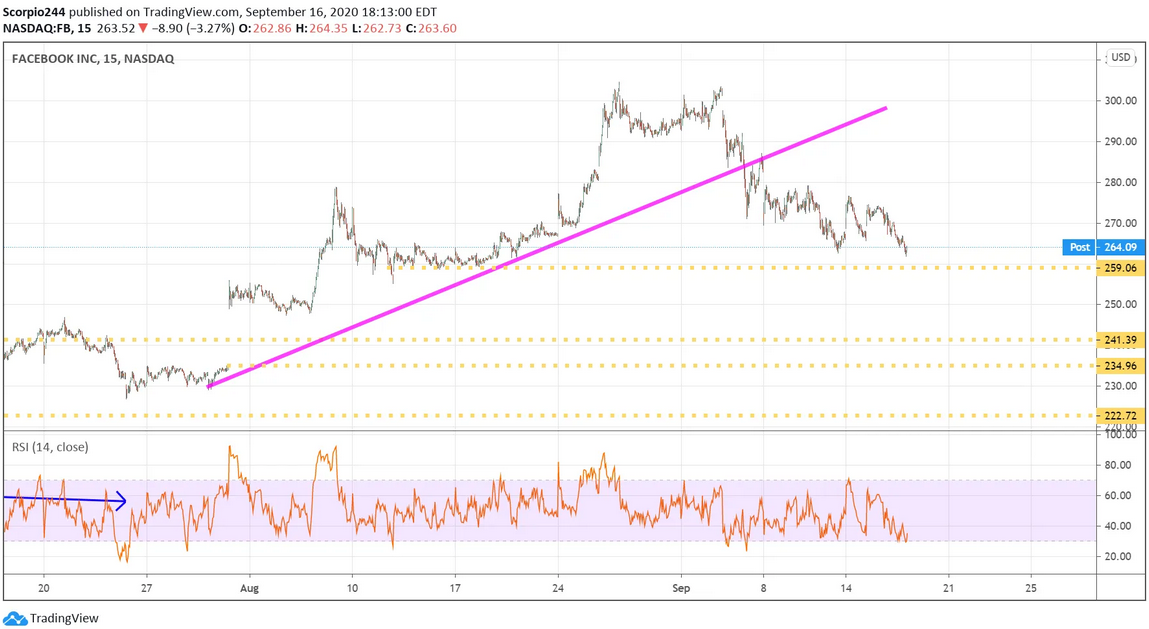
FB Chart
Original Post


